Matplotlib.pyplot将原本面向对象的作图操作封装成函数,使之更近似于MATLAB的交互式命令
只要有离散的数据,就可以做出柱状、散点、饼状、折线、3D图形等可视化图表
柱状图(bar)
pyplot.bar()只需提供两个数组作为各数据的横纵坐标,即可生成柱状图
1
2
3
4
5
6
7
8
9
10
11
12
13
from matplotlib import rcParamsfrom matplotlib.pyplot import *import numpy as npy = np.array((2100 , 3000 , 4000 )) x = np.array([1 , 2 , 3 ]) width = 0.2 rc('font' , size=16 ) bar(x, y, width) ylabel("消费数据" ) xticks(x, ["用户A" , "用户B" , "用户C" ], rotation=20 ) rcParams['font.sans-serif' ] = ['SimHei' ] savefig('bar.png' , dpi=500 ) show()
效果图:
若要显示负号,需rcParams['axes.unicode_minus']=False
散点图(scatter)
与bar类似
1
2
3
4
5
6
7
8
9
from numpy.linalg.linalg import _eigvalsh_dispatcherfrom pylab import * x = array(range(1 , 8 )) y = "27.0 26.5 26.3 26.1 25.7 25.3 24.8" y = "," .join(y.split()) y = array(eval(y)) scatter(x, y, marker='*' ) savefig("scatter.png" , dpi=500 ) show()
折线图(plot)
基本用法为plot(x,y,s),前两个参数为数据点的横纵坐标,s为指定线条颜色、线条样式和数据点形状的字符串
也可在同一个坐标内显示多个折线
1
2
3
4
5
6
7
8
9
10
11
12
13
14
15
import numpy as npfrom matplotlib.pyplot import *x = np.linspace(0 , 2 *np.pi, 200 ) y1 = np.sin(x) y2 = np.cos(pow(x, 2 )) rc('font' , size=16 ) plot(x, y1, 'r-' , label='$sin(x)$' , linewidth=2 ) plot(x, y2, 'b--' , label='$cos(x^2)$' ) xlabel('$x$' ) ylabel('$y$' , rotation=0 ) rc('legend' , loc='lower left' ) legend() savefig('plot.png' , dpi=500 ) show()
饼状图(pie)
只需一维数组
1
2
3
4
5
6
7
8
9
from matplotlib import rcParamsimport numpy as npfrom matplotlib.pyplot import *a = np.array([124 , 45 , 72 , 87 , 11 ]) pie(a, labels=["A产品" , "B产品" , "C产品" , "D产品" , "E产品" ]) title("销售额分析" ) rcParams['font.sans-serif' ] = ['SimHei' ] savefig("pie.png" , dpi=500 ) show()
子窗口(subplot)
subplot(nrows, ncols, index)
前两个参数将整个窗口分为nrows*ncols的区域
函数返回从上到下,从左到右的第index个区域(从1开始)
1
2
3
4
5
6
7
8
9
10
11
12
13
14
15
16
17
18
19
20
import numpy as npfrom matplotlib.pyplot import *x = np.linspace(0 , 2 *np.pi, 200 ) y1 = np.sin(x) y2 = np.cos(x) y3 = np.sin(x*x) rc('font' , size=16 ) ax1 = subplot(2 , 2 , 1 ) ax1.plot(x, y1, 'r' , label='$sin(x)$' ) legend() ax2 = subplot(2 , 2 , 2 ) ax2.plot(x, y2, 'b--' , label='$cos(x)$' ) legend() ax3 = subplot(2 , 1 , 2 ) ax3.plot(x, y3, 'k--' , label='$sin(x^2)$' ) legend() savefig('subplot.png' , dpi=500 ) show()
上方的两个窗口分别占据了2*2划分的前两个区域
下方窗口占据了2*1划分的第二个区域
三维曲线(plot3D)
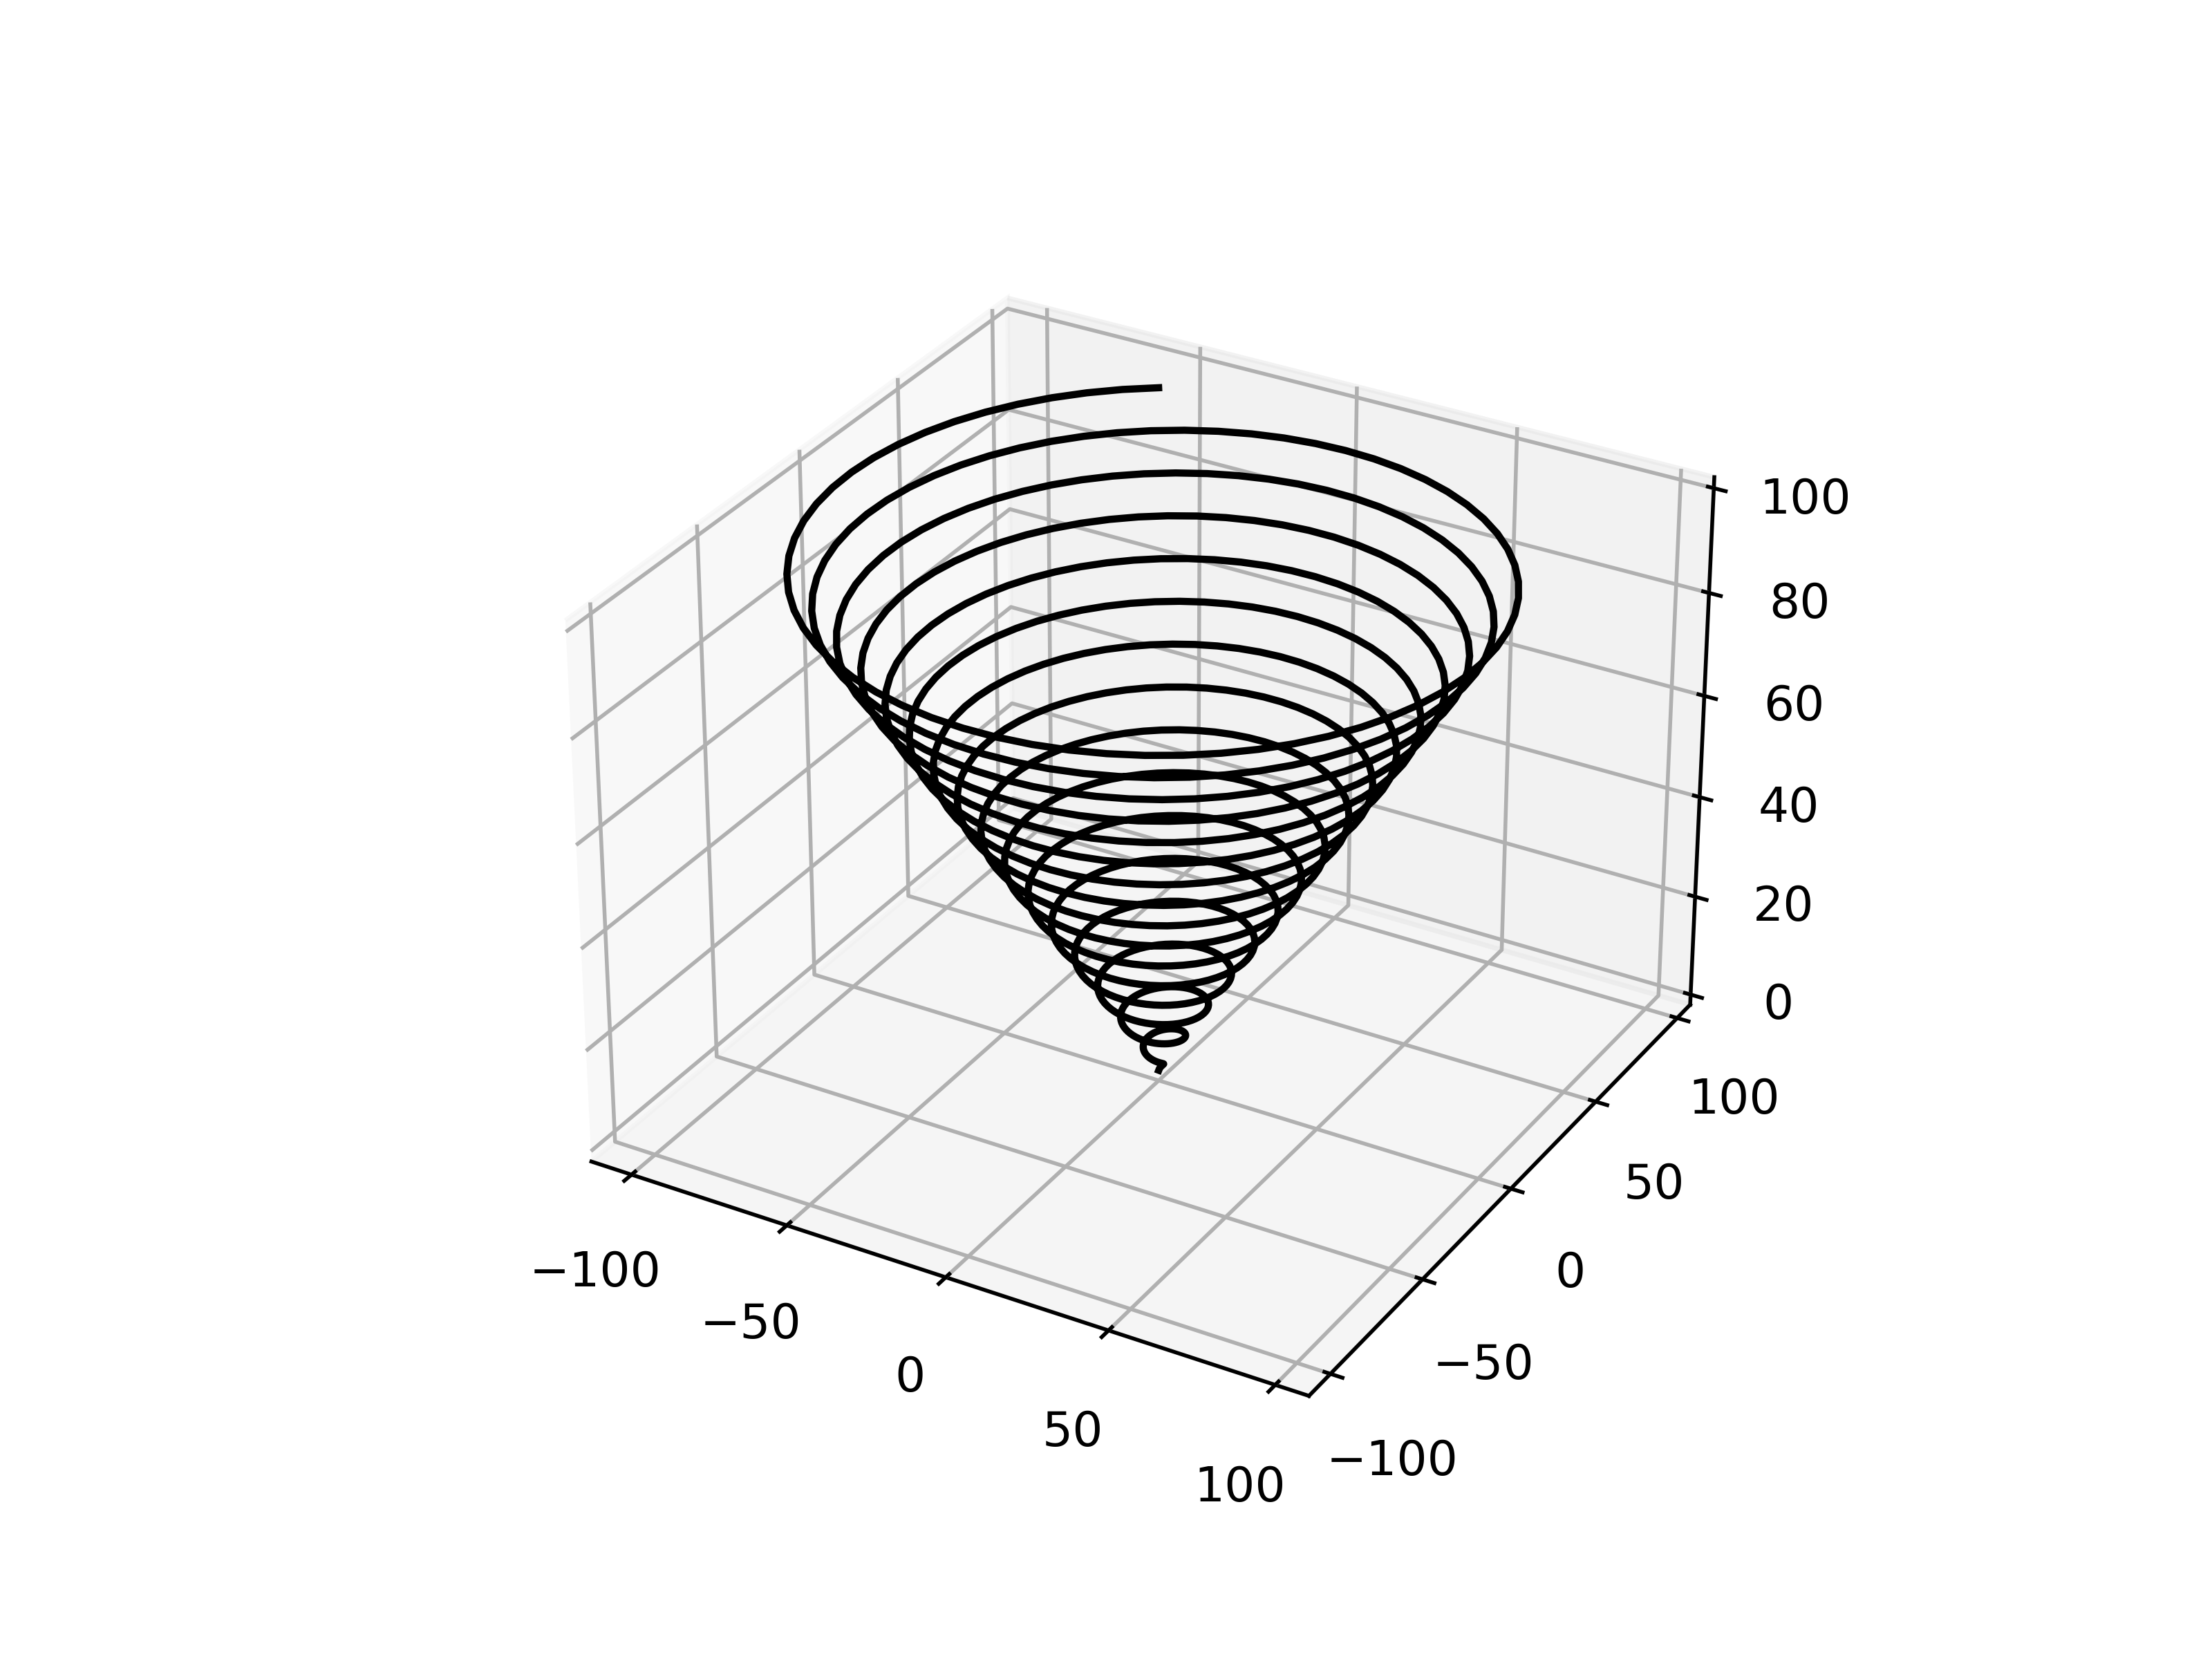
以下代码画出\(x=t\sin t,y=t\cos t,z=t\) 的图形
1
2
3
4
5
6
7
8
9
from matplotlib.pyplot import *import numpy as npax = axes(projection='3d' ) z = np.linspace(0 , 100 , 1000 ) x = np.sin(z)*z y = np.cos(z)*z ax.plot3D(x, y, z, 'k' ) savefig('plot3D.png' , dpi=500 ) show()
三维曲面(plot_surface,plot_wireframe)
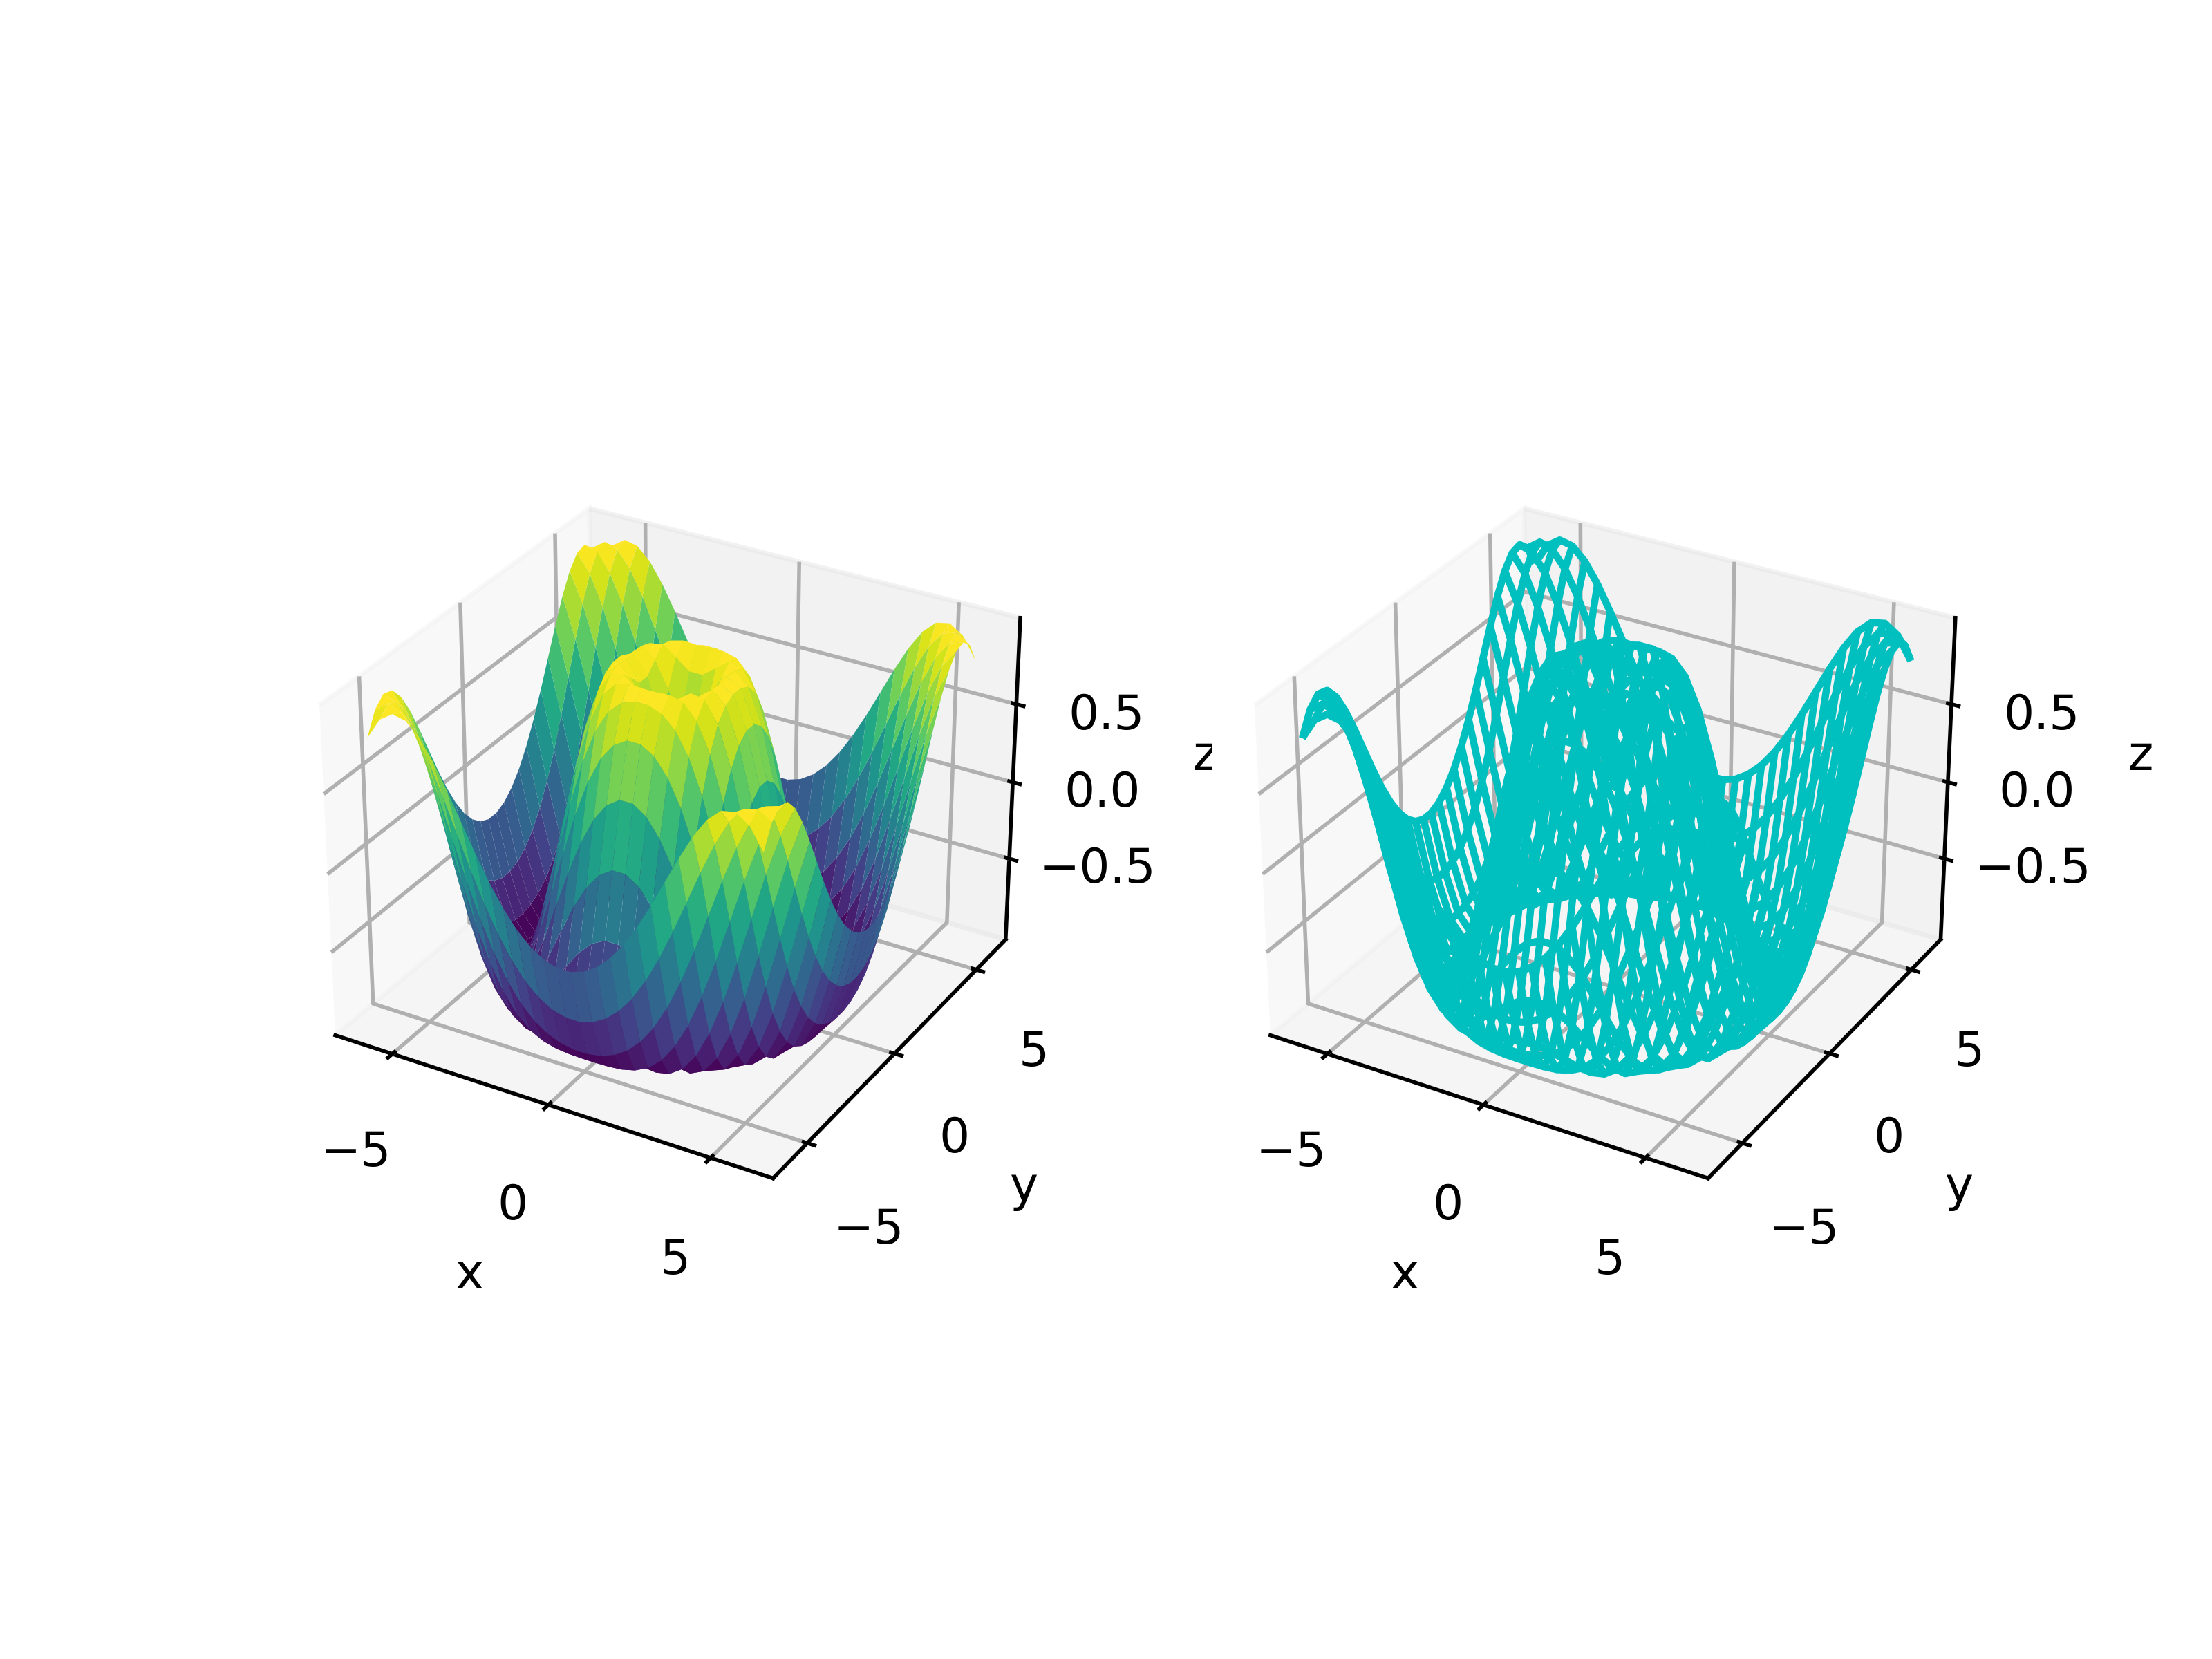
plot_surface生成表面图形,plot_wireframe生成网格图形
生成三维曲面时,需指定网格坐标(描点坐标)
以下代码画出\(z=\sin (\sqrt{x^2+y^2})\) 的图形
1
2
3
4
5
6
7
8
9
10
11
12
13
14
15
16
17
18
19
20
21
from matplotlib.pyplot import *import numpy as npx = np.linspace(-6 , 6 , 30 ) y = np.linspace(-6 , 6 , 30 ) X, Y = np.meshgrid(x, y) Z = np.sin(np.sqrt(X**2 +Y**2 )) ax1 = subplot(1 , 2 , 1 , projection='3d' ) ax1.plot_surface(X, Y, Z, cmap='viridis' ) ax1.set_xlabel('x' ) ax1.set_ylabel('y' ) ax1.set_zlabel('z' ) ax2 = subplot(1 , 2 , 2 , projection='3d' ) ax2.plot_wireframe(X, Y, Z, color='c' ) ax2.set_xlabel('x' ) ax2.set_ylabel('y' ) ax2.set_zlabel('z' ) savefig('plot_surface.png' , dpi=500 ) show()
等高线图(contour)
1
2
3
4
5
6
7
8
9
from matplotlib.pyplot import *import numpy as npz = np.loadtxt("data.txt" ) x = np.arange(0 , 1500 , 100 ) y = np.arange(1200 , -10 , -100 ) contr = contour(x, y, z) clabel(contr) savefig('contour.png' , dpi=500 ) show()
向量图(quiver)
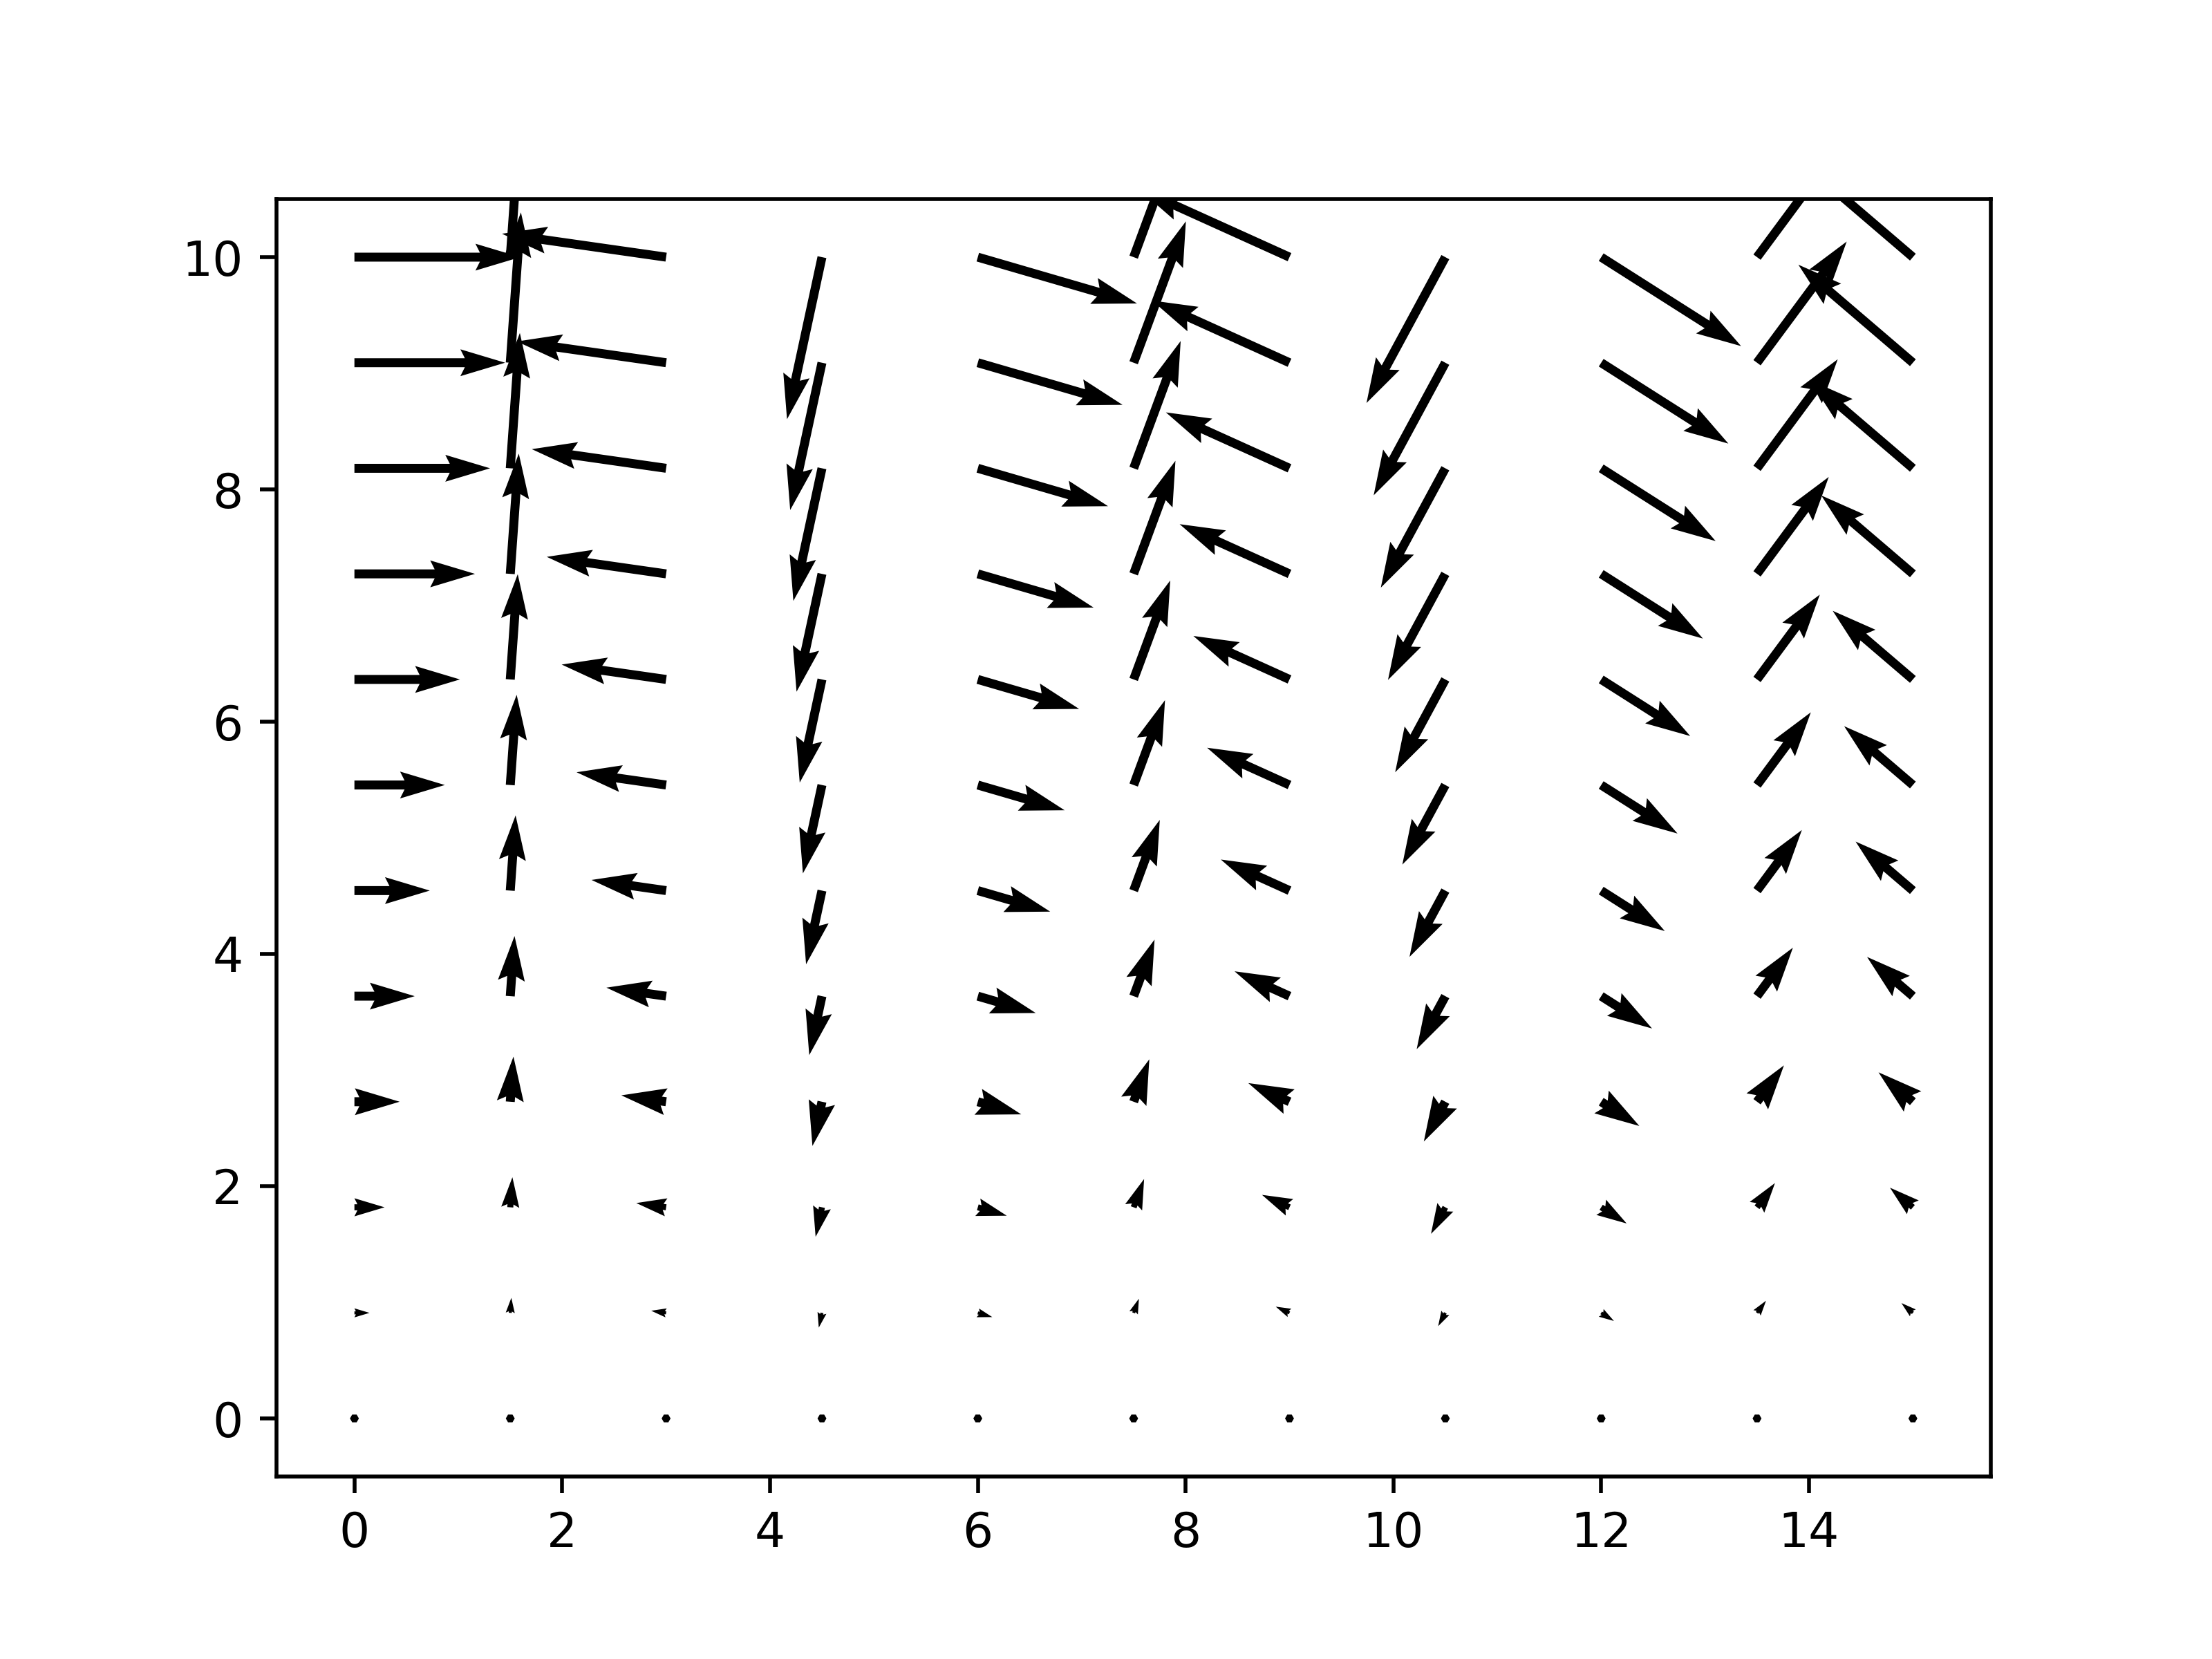
以下代码画出向量场\(\vec A=(y\cos x,y\sin x)\)
quiver(x, y, vx, vy)分别接收两个网格坐标矩阵,以及向量场的xy分量
1
2
3
4
5
6
7
8
9
10
from matplotlib.pyplot import *import numpy as npx = np.linspace(0 , 15 , 11 ) y = np.linspace(0 , 10 , 12 ) x, y = np.meshgrid(x, y) vx = y*np.cos(x) vy = y*np.sin(x) quiver(x, y, vx, vy) savefig('quiver.png' , dpi=500 ) show()


